
Quick answer
Referral conversion rate is the percentage of referral orders that result in a completed specialist visit within a defined window. The formula: completed referral visits ÷ referral orders placed × 100, usually measured at 30, 60, or 90 days. Because roughly one in three U.S. referrals is never completed, many organizations on manual workflows convert somewhere around two-thirds of referrals. A stronger version, in-network conversion rate, counts only visits completed with preferred-network specialists. Conversion rises when you remove the delays between order, authorization, scheduling, and attendance — the stages where patients drop out.
Key takeaways
- Conversion is one number, but it is the product of four or five stage-level rates.
- Measure at a fixed window (for example, 60 days) so months are comparable.
- Track in-network conversion separately; a completed out-of-network visit is still leakage.
- The biggest lifts come from speed: faster authorization, immediate outreach, and reminders.
How to calculate referral conversion rate
Referral conversion rate = (referrals with a completed specialist visit within N days ÷ referral orders placed in the period) × 100
In-network conversion rate = (referrals completed with a preferred-network specialist within N days ÷ referral orders placed) × 100
Example: A medical group places 2,000 referrals in March. By May 31 (a 60-day window), 1,316 patients have completed the specialist visit, and 1,050 of those were with in-network specialists.
- Referral conversion rate = 1,316 ÷ 2,000 = 65.8%
- In-network conversion rate = 1,050 ÷ 2,000 = 52.5%
That gap between 65.8% and 52.5% is out-of-network leakage among patients who did get care. The remaining 34.2% is referrals that never converted at all.
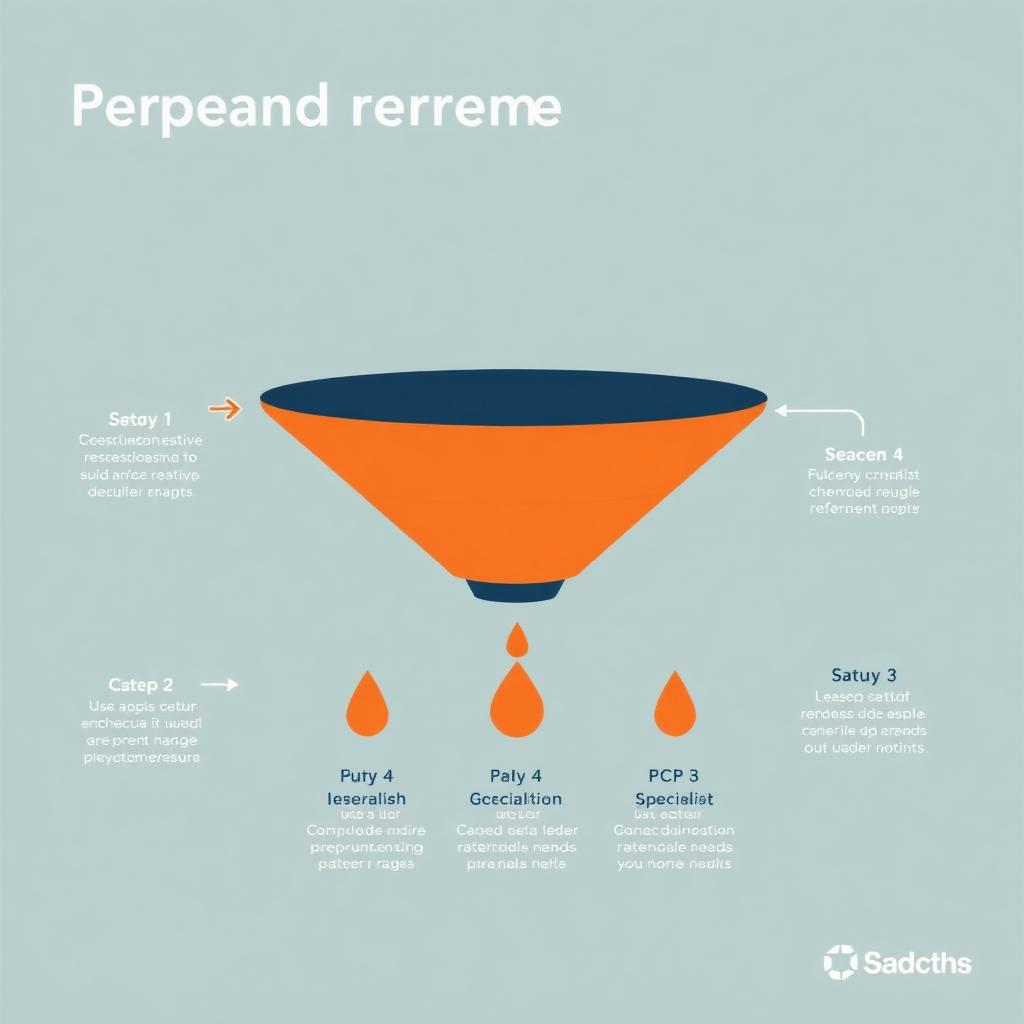
The funnel behind the number
| Stage | Stage rate | Example | Where it breaks |
|---|---|---|---|
| Order placed → routed to a specialist | 98% | 1,960 | Orders with no destination or missing information |
| Routed → authorized (if required) | 92% | 1,803 | Slow or denied prior authorization |
| Authorized → scheduled | 82% | 1,479 | Phone tag; patient never schedules |
| Scheduled → attended | 89% | 1,316 | No-shows, transportation, long waits |
| Attended → loop closed | 80% | 1,053 | Consult note never returns |
Multiply the first four stage rates and you get overall conversion (98% × 92% × 82% × 89% ≈ 65.8%); the fifth stage decides whether you can prove the visit happened. That is also why fixing one stage rarely moves the total as much as expected: the other stages still leak. Our five-step leakage funnel post goes deeper on the compounding effect.
Benchmarks: what good looks like
| Metric | Manual workflow (typical) | Automated, high-performing |
|---|---|---|
| Referral conversion rate (60-day) | ~60% to 70% | 80%+ |
| In-network rate among completed referrals | 65% to 75% | 85% to 92%+ |
| Time to appointment (routine) | 7+ days to schedule | 1 to 3 days to schedule |
| Prior authorization turnaround | 5 to 7 days | Same day to 2 days |
| Closed-loop rate | Under 50% | 85%+ |
These are directional ranges drawn from industry reporting and ReferralPoint deployments, not audited national benchmarks. Your own baseline is the benchmark that matters. For measuring in-network completion specifically, see how to measure in-network referral completion, and for the time component, time to appointment.
Six fixes that move referral conversion
- Route correctly at the point of order. When the clinician sees the best in-network specialist inside the EHR, fewer referrals stall or go out of network. Auto IdealMATCH does this. Vanguard Medical Group cut out-of-network referrals from 33% to 8%.
- Clear authorization fast. Each day waiting for a decision is a day the patient may go elsewhere. Auto PriorAUTH submits through payer APIs from one queue.
- Contact the patient immediately. Outreach the same day the referral is placed, by text or email in the patient's language. Privia Medical Group North Texas saw 90% of routine referrals self-scheduled by patients through SARA.
- Remind and remove barriers. Reminders, preparation instructions, and transportation help reduce first-visit no-shows. See reducing specialist no-shows.
- Close the loop automatically. Retrieve the consult note and file it, so completed referrals are counted as completed.
- Work the aging queue daily. Any referral with no status change in 7 days gets a human touch. Auto 360° VISIBILITY surfaces these by coordinator and specialty.
Common measurement mistakes
- Counting scheduled as completed. A scheduled visit is not a completed one; no-shows inflate the number.
- No fixed window. Without a 30-, 60-, or 90-day cutoff, recent months always look worse.
- Ignoring in-network. High conversion with high leakage still costs a value-based contract money.
- Excluding referrals that went to fax. If the system cannot see them, they still count in the denominator.
- Not segmenting. Conversion differs widely by specialty, payer, language, and clinic. Averages hide where to act.
Bottom line
Referral conversion rate is the clearest single measure of whether your referral program works. Calculate it on a fixed window, track in-network conversion alongside it, and attack the stage-level delays that drive it down. Request a demo to see your conversion funnel by specialty and payer.
FAQ
Q: What is referral conversion rate in healthcare? A: The percentage of specialist referral orders that result in a completed specialist visit within a set time window.
Q: How do you calculate referral conversion rate? A: Divide referrals with a completed specialist visit within N days by referral orders placed in the period, then multiply by 100.
Q: What is a good referral conversion rate? A: Many organizations on manual workflows convert around 60% to 70% of referrals; high-performing automated programs reach 80% or more, with 85%+ of completed referrals kept in-network.
Q: What is the difference between referral conversion rate and in-network rate? A: Conversion measures whether the patient was seen at all. In-network rate measures whether the visit was with a preferred-network specialist. In-network conversion combines both.
Q: Why do referrals fail to convert? A: Missing information at order, slow prior authorization, patients who are never contacted or never schedule, no-shows, and consult notes that never return.
Q: How often should referral conversion be reported? A: Monthly at minimum, segmented by specialty, payer, clinic, and provider, with weekly review of aging referrals.
Sources and notes
The example funnel and benchmark ranges are illustrative and directional. The one-in-three completion gap is a widely reported industry range. ReferralPoint outcomes are on our sourced metrics page.